Seamless data visualisation is the need of the hour for almost every business. Times are changing, and therefore, your tools’ ecosystems need some customisations too. And there is no better tool than Dynamics 365.
However, you might need to embed Power BI dashboards in D365 for better visualisation of data. The Power BI integration with Dynamics 365 provides an eagle-eye view, enabling you to track metrics on time and make informed business decisions.
Previously, we explored the difference between Power BI vs. Excel, highlighting how Power BI simplifies analytics and reporting compared to traditional spreadsheets.
You can also check out our related Power Platform guides — How to create a custom approval dashboard in Power Apps and how to generate and download PDFs directly from Power Apps Forms.
In this blog, we’ll take things a step further by showing you how to embed your Power BI Dashboards directly within Dynamics 365 for real-time insights.
Why Embed Power BI in Dynamics 365?
Analytics can be integrated directly into your operational system by integrating Power BI dashboards in Dynamics 365. Your users can drill into reports, view real-time visuals, and act on insights without ever leaving D365, eliminating the need to switch between tools. This strategy:
- Allows Real-time data monitoring using Power BI in operations, finance, sales, and service.
- Ensures context-sensitive analytics, strengthening the connection between Power BI and Dynamics 365.
- Improves decision-making and user adoption by integrating analytics into business operations.
- Helps centralise reporting logic and minimises redundant reporting (in contrast to Excel exports).
The integration is well-supported under D365 Implementation and Power BI implementation strategies because Microsoft views this as a first-class scenario.
Prerequisites & Planning
Before you start embedding the dashboard, make sure:
- You have access to the corresponding environment and Dynamics 365 (model-driven apps or relevant Dynamics 365 modules).
- You have at least one dashboard or report uploaded to Power BI, and you have a Power BI account (with Pro or Premium licensing).
- Your D365 environment and the Power BI tenant are housed under the same Microsoft Entra (Azure AD) domain.
- You are aware of data connectivity: instead of using direct SQL access for reporting over D365 data, many people use the Dataverse connector or Entity store.
- The system administrator of your company is prepared to approve cross-service access and enable embedding.
Step By Step Tutorial: How to Embed Power Bi Dashboards in Dynamics 365
So, how to connect Power BI to Dynamics 365? Here is a step-by-step tutorial for you:
Step 1: Create your Power BI report (or dashboard) and publish
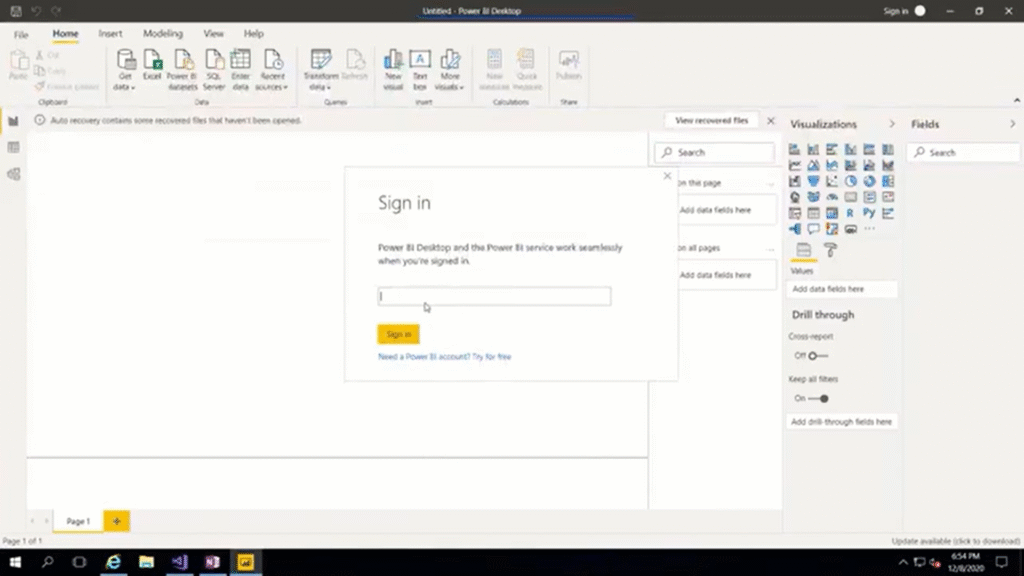
- Open Power BI Desktop (or Power BI service) and enter your login credentials.
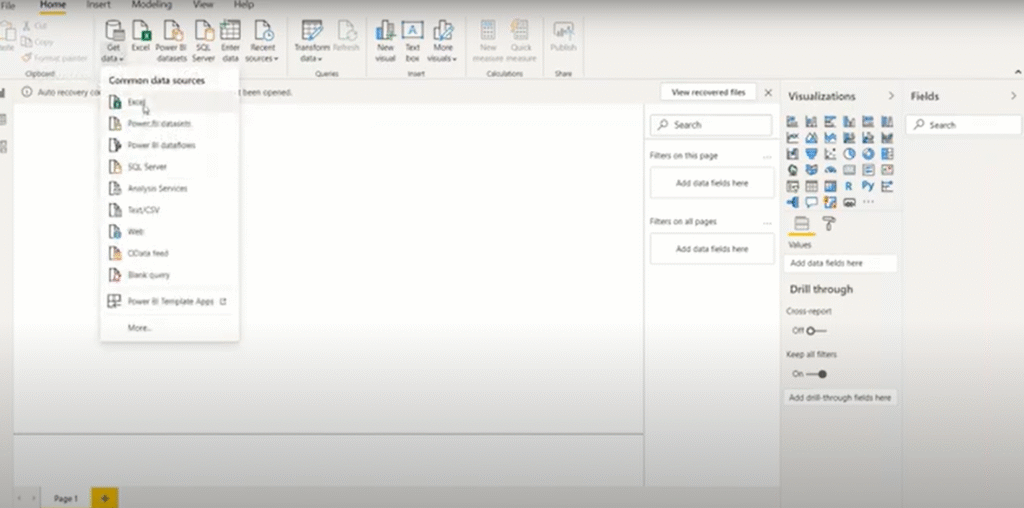
- Load data, for instance, by connecting via OData or importing from Excel (or any source).
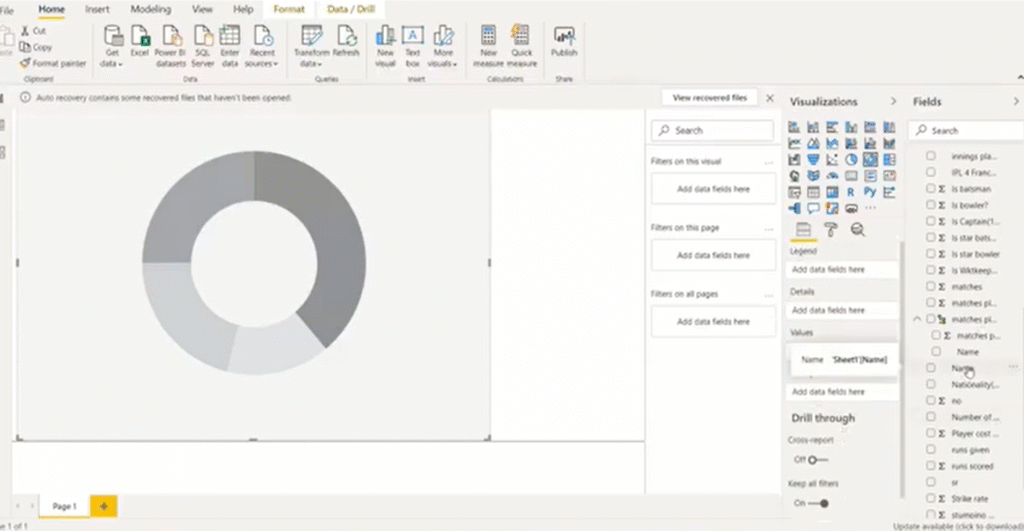
- Create visualisations by configuring tooltips, legends, values, and other elements.
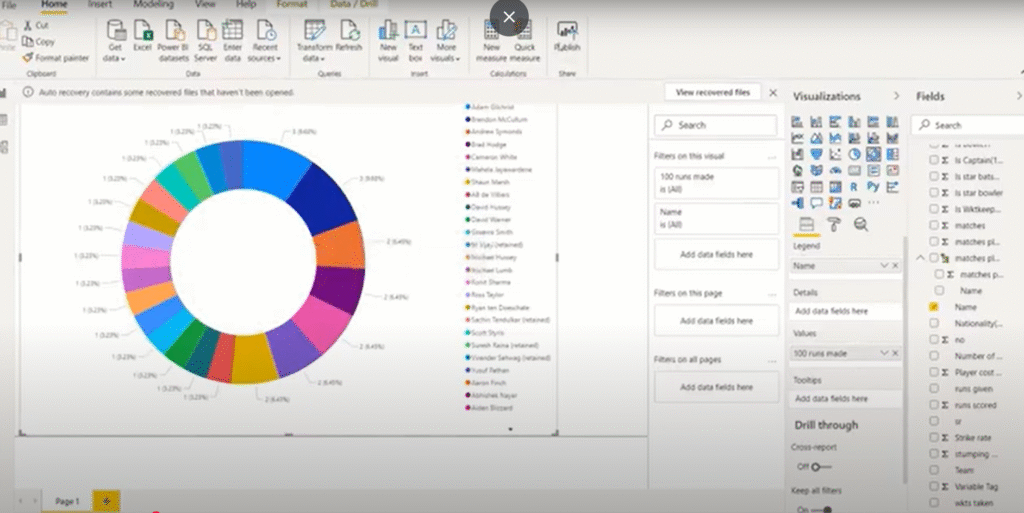
- Click Publish once the images are ready.
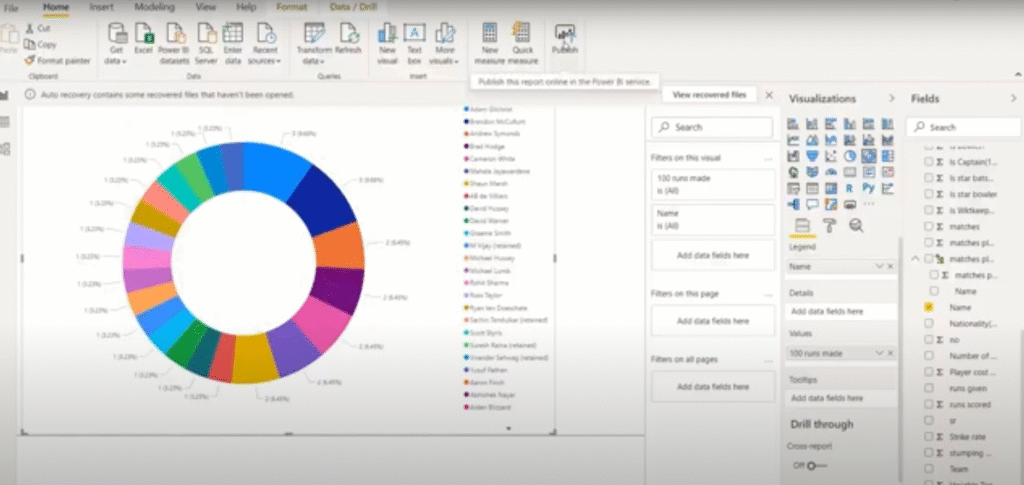
- In Power BI, select the workspace where the dashboard or report will be stored.
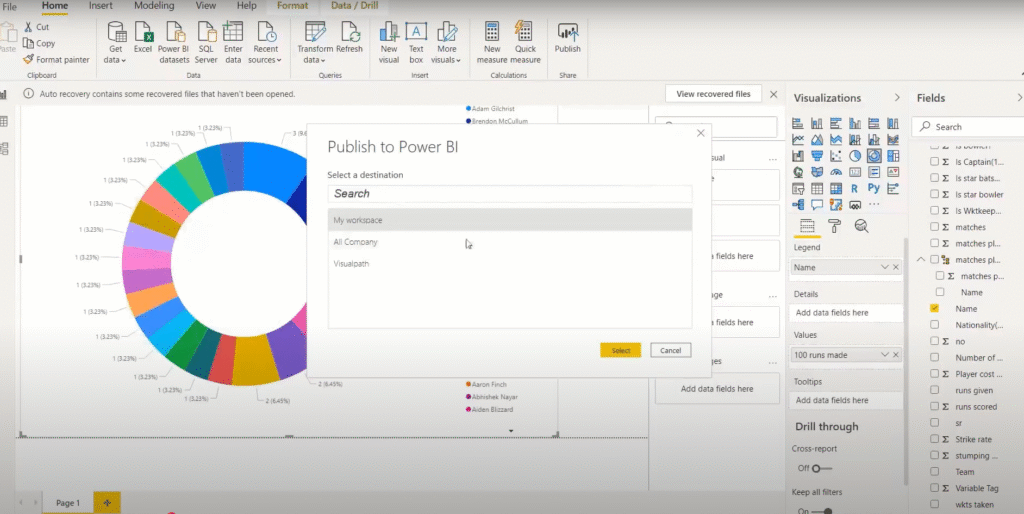
- Make sure your report is accessible in the workspace and that your Power BI account has access after publishing.
Visuals from the report can be optionally pinned to an existing or new dashboard, providing a “live tile” that can be embedded.
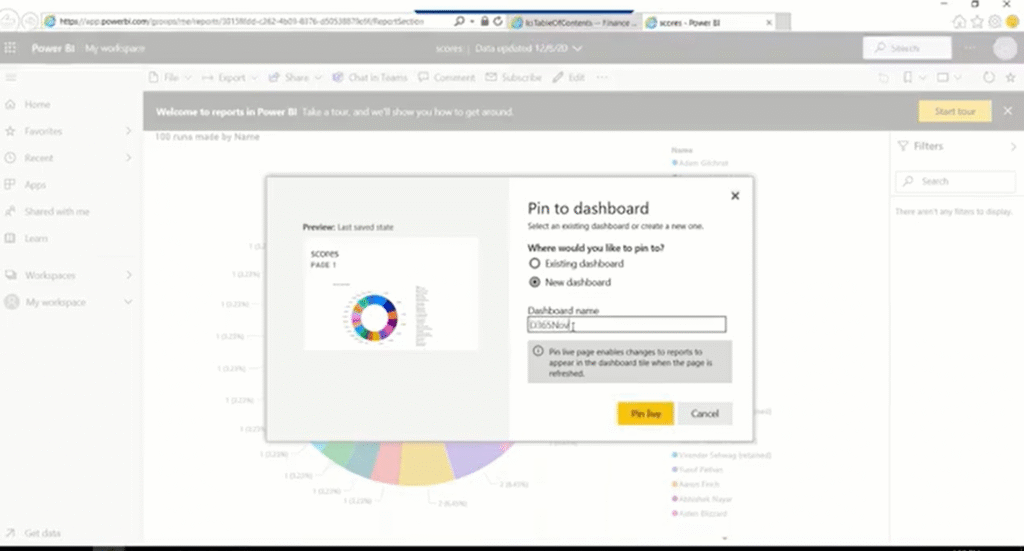
Step 2: Enable embedding visuals in D365 (Dynamics 365 setup)
To Display Power BI reports in Dynamics 365, first follow the settings below:
- Go to Settings → Advanced Settings in Dynamics 365.
- Go to Administration and then System Settings or Reports (based on the version) in the traditional admin user interface.
- Locate the “Set whether users can embed Power BI visuals/visualisation embedding” (or “Allow Power BI embedding”) setting under the Reporting (or comparable) section.
- Switch it from “no” to “yes” (enable it).

5. Since the embedding uses Power BI service authentication, comply with any consent prompts.
6. Save/OK.
There are additional options for adding Power BI content after this is enabled.
Once enabled, reload the Dynamics 365 user interface. Power BI Dashboard options should be visible under Dashboard > New.
Step 3: Embed a Power BI dashboard into Dynamics 365
When embedding is enabled, take these actions:
- Get to the Dashboards section of Dynamics 365.
- Choose Power BI Dashboard (also known as “Power BI embedded”) as the type after clicking New.
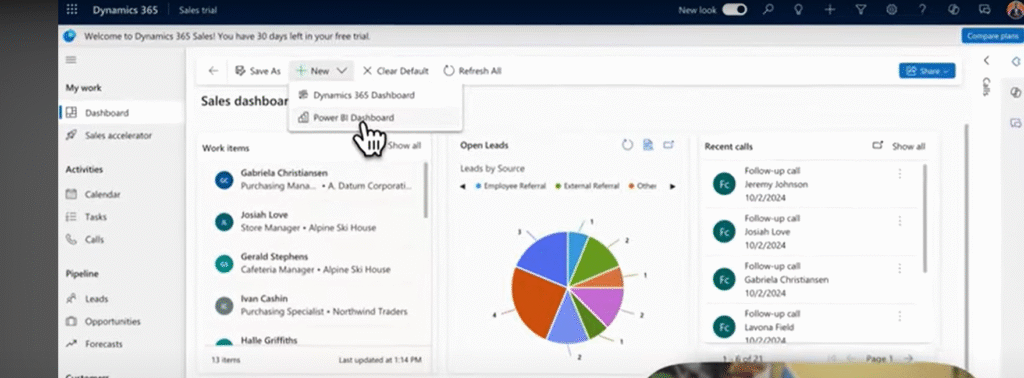
3. Select the Power BI workspace and the dashboard you previously published (such as dashboard sample 01) from the dialogue box.

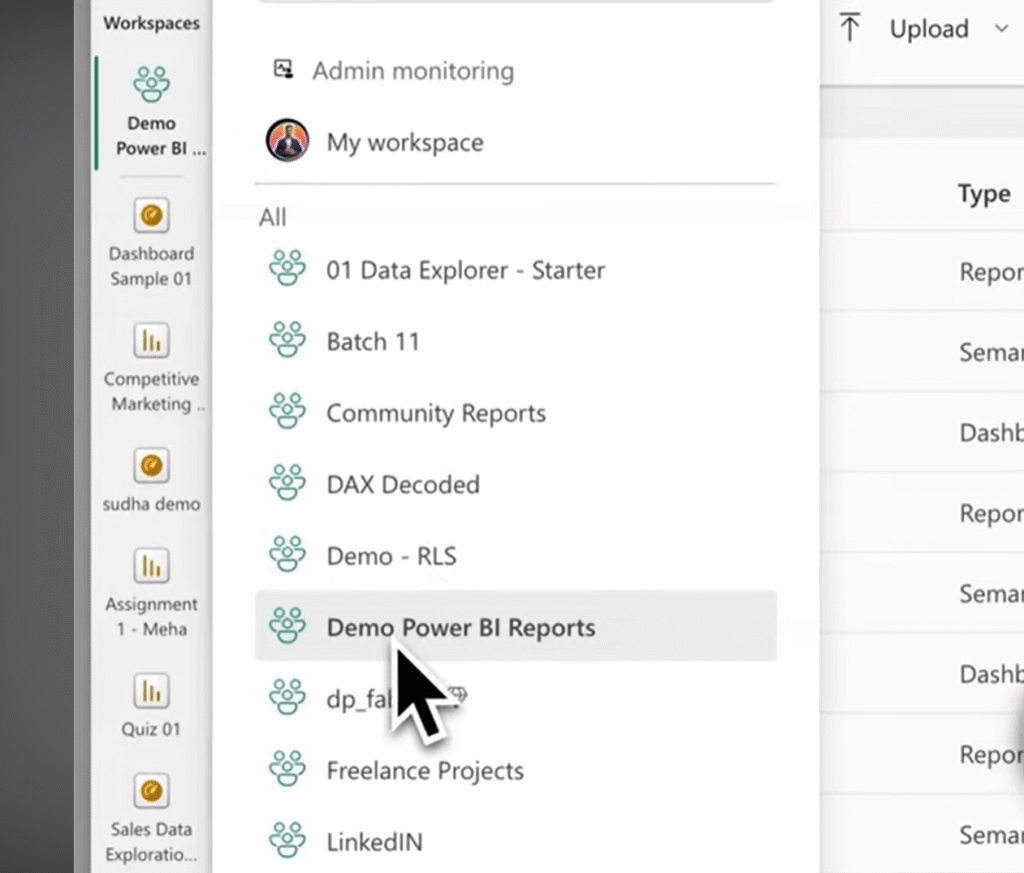
4. If supported, turn on the dashboard for unified clients (phones and tablets).
5. Click “Save.”
The dashboard will show up in your list of Dynamics 365 dashboards after it has been saved. A preview of the embedded dashboard might be shown to you.
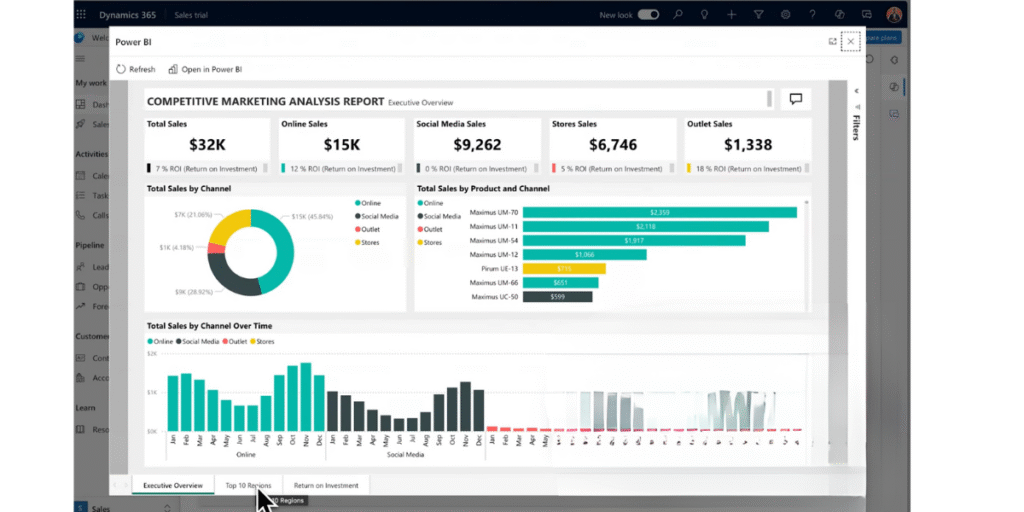
Step 4: (Optional) Add Power BI tiles or visuals to specific D365 forms or pages
If additional integration (beyond dashboards) is desired:
- Certain Dynamics 365 model-driven applications allow you to use the Power BI Embedded control to embed Power BI reports or visuals straight into form pages or entity forms.
- In that scenario, you insert the Power BI control on a form and set it to point to a report or tile instead of embedding entire dashboards through the Dashboard menu.
- Make sure the RLS (row-level security), security, and authentication settings permit the proper data filtering for each record.
Note: In this case, the Dynamics 365 version, licensing (Premium, Embedded capacity), and permissions are essential.
Best practices to overcome any challenges in embedding Power BI dashboards in D365:
- To prevent cross-workspace embedding problems, keep your dataset and images in the same workspace.
- Utilise naming conventions to simplify the process for D365 users to select the appropriate dashboards.
- To limit data exposure, use row-level security.
- To facilitate faster embedding, encourage users to pin frequently used images to dashboards.
- Ensure your source data is up-to-date and regularly monitor refresh schedules.
Conclusion
Embedding Power BI dashboards in Dynamics 365 brings powerful data insights directly into your business environment. It enables real-time visualisation, centralised reporting, and actionable intelligence—all within one system.
Whether it’s for finance, operations, or sales, this integration ensures seamless decision-making and enhances productivity.
At DHRP, we help businesses with Dynamics 365 Implementation and optimise Dynamics 365 Power BI reporting setups, ensuring that dashboards are properly configured, secure, and performance-ready.
From system setup to user training, our experts make sure your Power BI dashboards work efficiently within Dynamics 365, helping you turn data into strategic business outcomes.
The screenshots used in this blog are taken from this YouTube channel.
FAQs
You can embed Power BI dashboards in Dynamics 365 by enabling Power BI embedding in system settings, publishing your report, and linking it to a D365 dashboard from the Power BI workspace.
Integration involves publishing your Power BI report, enabling embedding within Dynamics 365 settings, selecting the workspace, and connecting the desired dashboard to your Dynamics 365 instance for seamless data visualisation.
Yes, you can display Power BI reports directly in Dynamics 365 dashboards by enabling embedding and selecting the required Power BI dashboard or report to appear within your D365 environment.


