Whenever you open Dynamics 365, you see a dashboard with charts, graphs, and tasks. But have you ever tried to use a colleague’s dashboard, and it looks like their personal space? If you have, you probably want to make your dashboard as you need it. It eases your way to the tasks and processes you want to monitor.
Moreover, Dynamics 365 dashboards seem quite sufficient, but most often, you just need relevant data under the spotlight. This is when you customise your Dynamics 365 dashboard. But how can you customise dashboards in D365?
We will walk you through the steps in this Dynamics 365 dashboard customisation tutorial.
What Do You Need to Know about Dynamics 365 Dashboards and Components?
Before you learn How to build dashboards in Dynamics 365, you must understand the dashboards and their components.
Dashboards in Microsoft Dynamics 365 are an effective way for businesses to track and analyse data quickly and conveniently. They provide information on customer trends, performance, and other indicators that can help businesses make smarter decisions and better serve their customers.
To construct the most successful dashboard, it is critical to understand the many types of dashboards available, as well as the components that each type includes.
Dashboards are classified into three types:
- Single Stream
Single stream dashboards are made up of a single chart or graph that shows only one collection of data points at a time.
- Unified Interface (multi-stream)
Unified interface dashboards consist of several charts or graphs arranged into parts on a single page. They are typically used when multiple sets of data must be displayed on a page (for example, sales details by area).
- Interactive Experience
Interactive experience dashboards enable users to engage with the dashboard features. They can personalise their display using global filters, visual filters, tiles, and other components based on their specific needs and preferences.
Isn’t it great? Right? Let’s TALK action now!
Steps For Custom Dynamics 365 Dashboard Setup Guide
A dashboard is a data visualisation tool allowing you to quickly comprehend your business’s current situation. Furthermore, a well-designed dashboard may provide essential insights that can help to build plans and guide corporate decisions. So, here are the steps to create custom dashboards in D365:
There are just easy ways to do it. Create and design the display information to be exactly suitable for your needs.
- Step 1:
Open Dynamics 365, and under My Work, select Dashboards. Once done, click “New.”

- Step 2:
Then, a drop-down box opens with two options: construct a Dynamics 365 dashboard or a Power BI dashboard. Our focus right now is only on creating a dashboard in Dynamics 365.

- Step 3:
Choose a layout, then click Create.

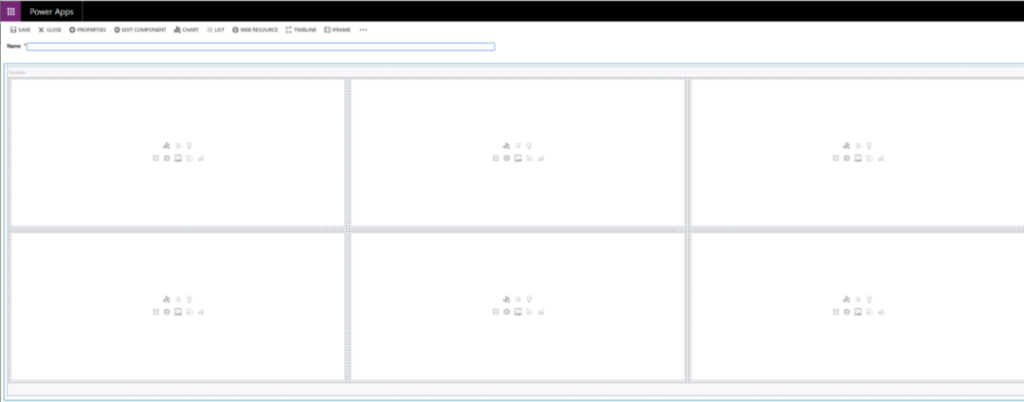
A screen will appear with a space to name your dashboard and six boxes to fill it with your components.

- Step 4:
There are eight different component types that can be placed in any of the dashboard’s slots. A dashboard can display data in up to six different slots. The component types available are as follows:
A screen will appear with a space to name your dashboard and six boxes to fill it with your components.
- 1. Insert Chart Insert List to display D365 data.
- 2. Insert Assistant - displays data for the Customer Insight add-on, such as scheduled meetings and AI ideas.
- 3. Insert iFrame: Display an external or internet web page on a dashboard.
- 4. Insert Web Resource - web resources display custom charts created by developers in other programs, such as mapping data from Maplytics.
- 5. Add a Power BI tile to your dashboard and view a Power BI chart or visualisation within Dynamics 365.
- 6. Insert Organization Insights to access statistics about your organisation.
After you’ve selected the component type, you’ll need to decide which table to display and how it should be rendered.

- Step 5:
Once you’ve completed adding components, click Save. When you close this screen, your customised dashboards appear in a drop-down menu.
Note: you can also choose the layout for your components.
Do You Already Have a Custom Dashboard? Edit it:
You made custom reporting in Dynamics 365 dashboards and deep analytics easy in the dashboard, but now you want to make some changes. Here are the steps to edit your custom dashboard:
- Open Solution Explorer and navigate to Components > Dashboards.
- Open a dashboard by double-clicking it, selecting one component region and clicking Edit Component.
- Make your desired modifications in the Set Properties dialogue box. When you're finished, select Set.
- To learn more about setting properties, read Set Properties for a chart or list on a dashboard.
- When you've finished making changes, save them and then publish them.
- You can conduct other system dashboard functions, such as:
- Delete a list or chart from a dashboard.
- Include a list or chart in a dashboard.
- Set the default dashboard.
- Use security roles to make a dashboard viewable only to specific roles.
How DHRP Can Help?
Finally, you have your reporting going right and making better decisions. Wait, you still need assistance in full Dynamics 365 Implementation. This is where DHRP comes in.
Let our expert developers and certified consultants make the process smooth and custom to your business needs. Reach out now and start with DEMO today!


